Hackney
On 30 June 2026, 373 asylum seekers with an address in Hackney were in Home Office support, 1.4 per 1,000 residents, the 115th highest of 361 councils. London, England. 266,241 residents in mid-2025.
- Council seats
- Green holds more than half the seats (42 of 57).
- 42 Green
- 9 Labour
- 6 Conservative
- MPs elected in 2024
- 4 constituencies overlap the council. Labour 4.
- Hackney North and Stoke Newington · Labour45%
- Hackney South and Shoreditch · Labour43%
- Tottenham · Labour8%
- Islington South and Finsbury · Labour4%
- Area type
- Urban: Majority nearer to a major town or city
A pattern across places is not cause. A council's figures describe the area, not the people in it.
Where Hackney stands out
The measures where it is among the highest or lowest tenth of the councils ranked, nearest the end first. Population is left out.
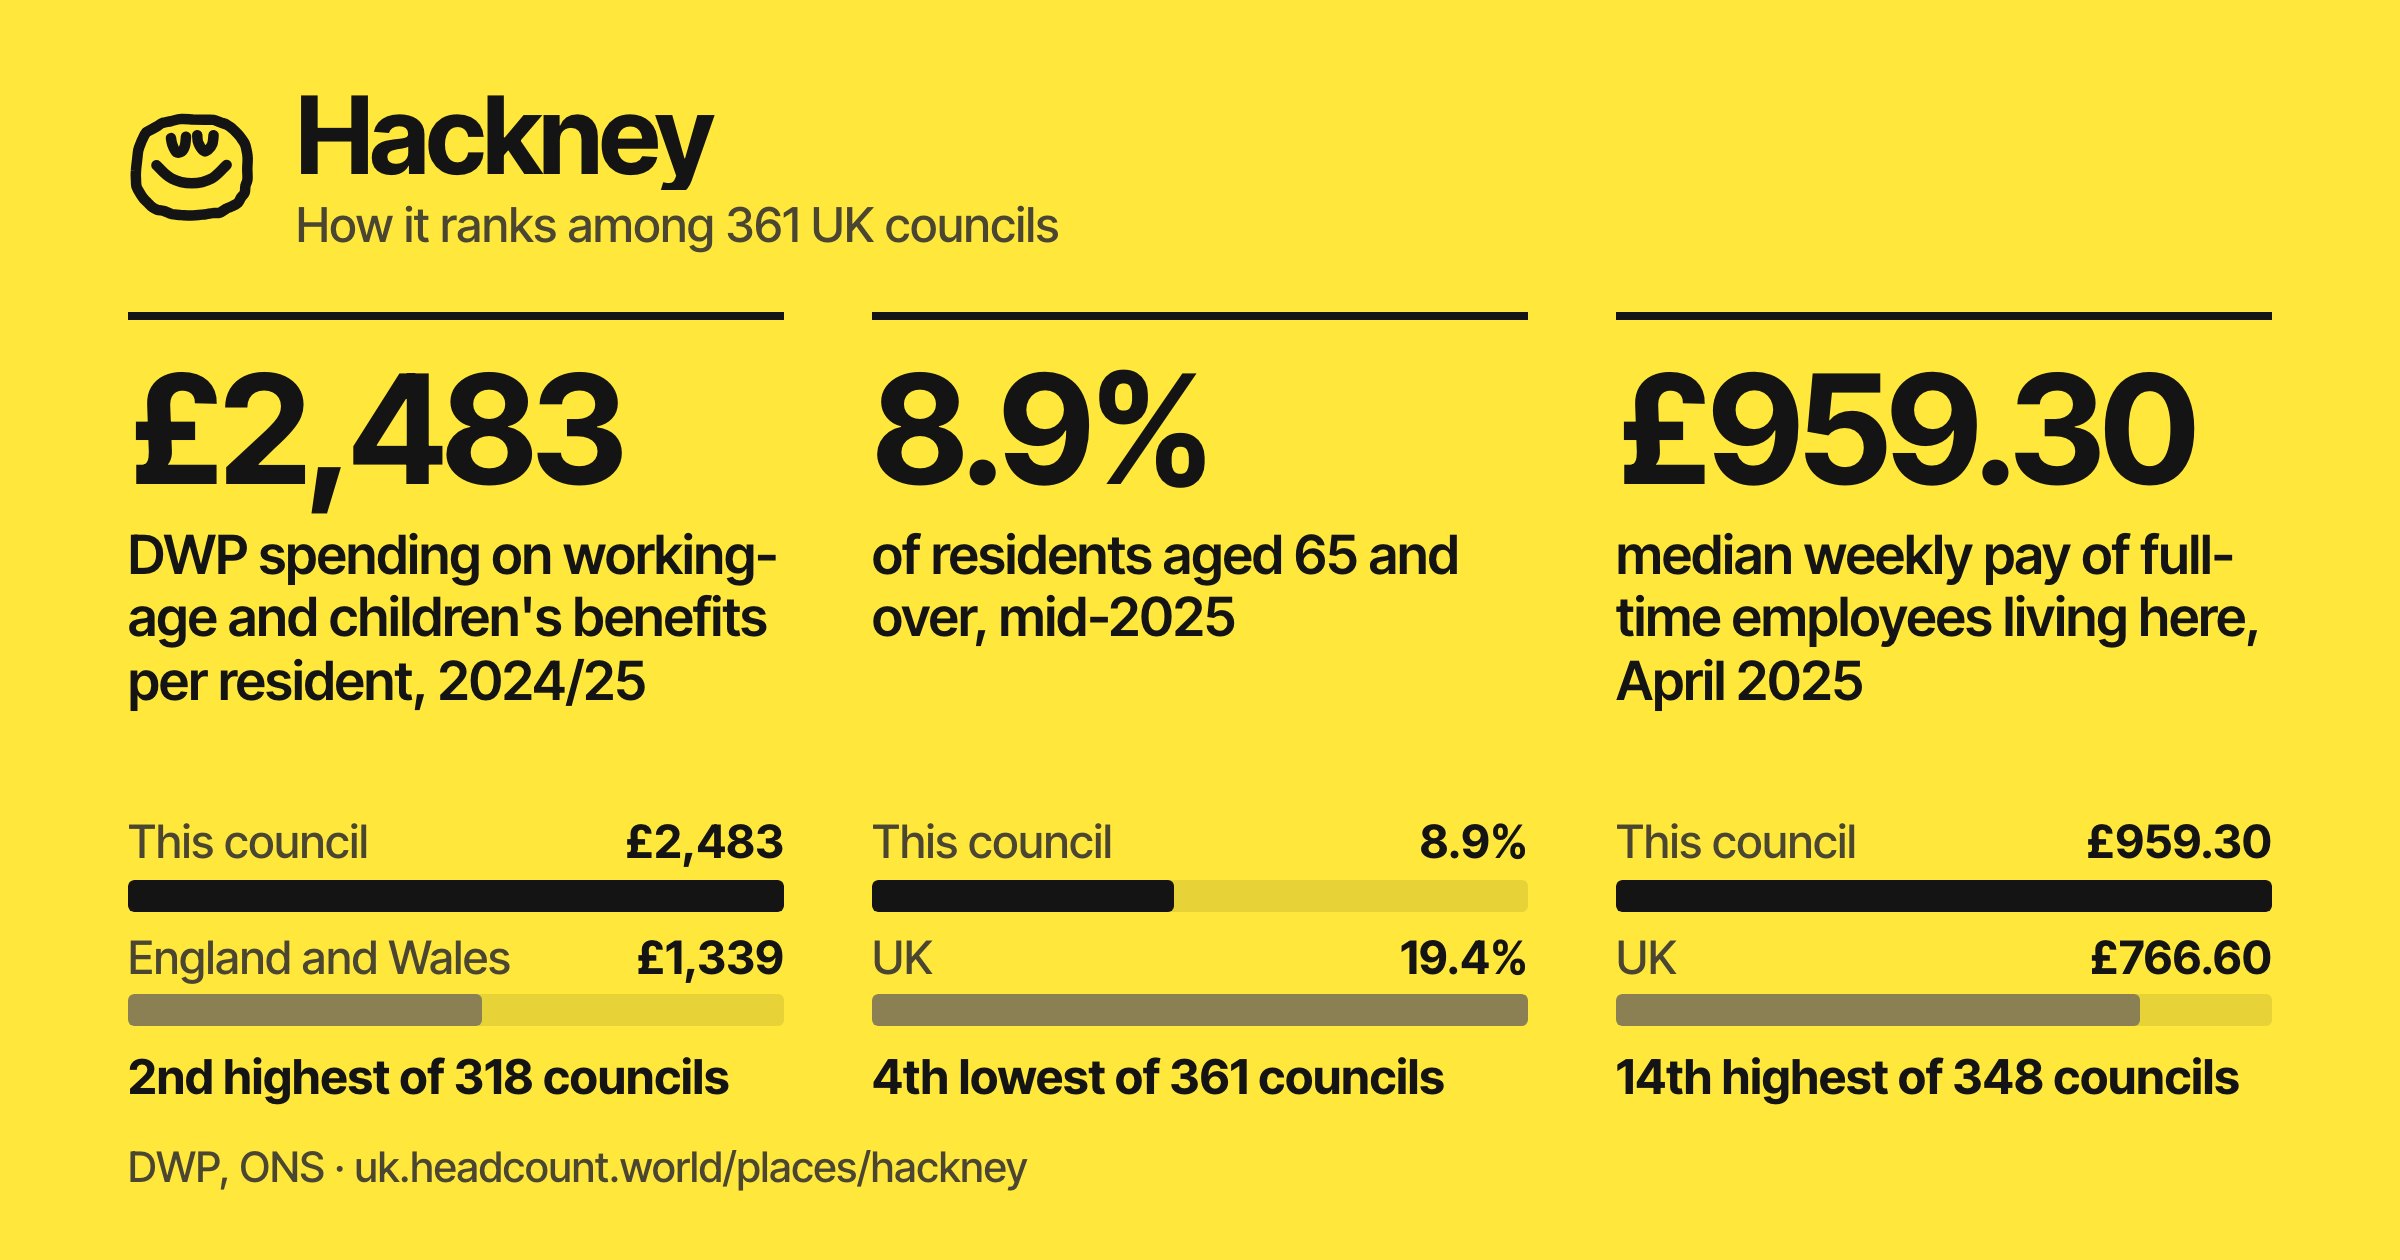
£2,483
DWP spending on working-age and children's benefits per resident, 2024/25
2nd highest of 318 councils · England and Wales £1,339
8.9%
of residents aged 65 and over, mid-2025
4th lowest of 361 councils · UK 19.4%
£959.30
median weekly pay of full-time employees living here, April 2025
14th highest of 348 councils · UK £766.60
2.3%
moved abroad in the year to mid-2025
18th highest of 361 councils · UK 1.0%
Every measure
Each bar is on one scale with the average of its councils like this and the UK figure. Population compares with the median council, DWP spending with England and Wales.
People
Population
people · mid-2025 (30 June 2025)
What this counts
- What it counts
- Usual residents on 30 June 2025
- Period
- mid-2025 (30 June 2025)
- Source
- Office for National Statistics, Population estimates for the UK, England, Wales, Scotland and Northern Ireland: mid-2025 (MYE2 - Persons (single year of age, local authorities))
- Status
- Official statistics
Aged 65 and over
% of residents · mid-2025 (30 June 2025)
What this counts
- What it counts
- Residents aged 65 or over as a share of all residents
- Period
- mid-2025 (30 June 2025)
- Worked out from
- 23,716 over 266,241
- Source
- Office for National Statistics, Population estimates for the UK, England, Wales, Scotland and Northern Ireland: mid-2025 (MYE2 - Persons (single year of age, local authorities))
- Status
- Official statistics
Born outside the UK
% of residents at the census · Census 2021 (Scotland 2022)
What this counts
- What it counts
- Usual residents born outside the UK, as a share of all usual residents, at the census (21 March 2021 in England, Wales and Northern Ireland; 20 March 2022 in Scotland)
- Period
- Census 2021 (Scotland 2022)
- Worked out from
- 102,927 over 259,146
- Coverage
- England and Wales: ONS's council table TS004. Northern Ireland: NISRA's council table MS-A16. Scotland: the sum of the 2022 data zones in NRS table UV204b, as on the site's map (no NRS council table is used)
- Source
- Office for National Statistics, Census 2021: Country of birth (TS004), lower tier local authorities, England and Wales (census2021-ts004-llta.csv: 'Country of birth: Total' and 'Country of birth: Europe: United Kingdom' (2021 council codes; the 2023 Cumbria, North Yorkshire and Somerset councils are the sum of the districts they replaced))
- Status
- Accredited official statistics (census)
Moved here from abroad in the year to mid-2025
% of residents at the start of the year · July 2024 to June 2025
What this counts
- What it counts
- International immigration into the council in the year to 30 June 2025, as a share of its residents on 30 June 2024. Long-term moves (12 months or more), modelled
- Period
- July 2024 to June 2025
- Worked out from
- 6,426 over 268,651
- Source
- Headcount (built from ONS, NRS and NISRA), data/map_areas.json: census born abroad and year-to-mid-2025 international migration by local authority (las (census_total, census_born_eu, census_born_rest_of_world) and migration['2025'].rows (immigration, emigration, population_start_of_year))
- Status
- Official statistics. Scotland's figures for this year are provisional (NRS)
Moved abroad in the year to mid-2025
% of residents at the start of the year · July 2024 to June 2025
What this counts
- What it counts
- International emigration from the council in the year to 30 June 2025, as a share of its residents on 30 June 2024
- Period
- July 2024 to June 2025
- Worked out from
- 6,181 over 268,651
- Source
- Headcount (built from ONS, NRS and NISRA), data/map_areas.json: census born abroad and year-to-mid-2025 international migration by local authority (las (census_total, census_born_eu, census_born_rest_of_world) and migration['2025'].rows (immigration, emigration, population_start_of_year))
- Status
- Official statistics. Scotland's figures for this year are provisional (NRS)
Asylum, resettlement and Ukraine
People in Home Office asylum support
per 1,000 residents · 30 June 2026
What this counts
- What it counts
- People (main applicants and dependants) receiving Home Office asylum support (sections 95, 98 and 4, all accommodation types and subsistence only) whose recorded address is in the council, on 30 June 2026. Excludes unaccompanied asylum-seeking children, who are looked after by councils
- Period
- 30 June 2026
- Worked out from
- 373 over 266,241
- Source
- Home Office, Asylum seekers in receipt of support by local authority detailed datasets, year ending June 2026 (Asy_D11 (sheet Data_Asy_D11)); Office for National Statistics, Population estimates for the UK, England, Wales, Scotland and Northern Ireland: mid-2025 (MYE2 - Persons (single year of age, local authorities))
- Status
- Accredited official statistics (support data from 2018 marked provisional by the Home Office)
Refugees resettled through UK schemes since 2021
per 1,000 residents · January 2021 to June 2026 (arrivals)
What this counts
- What it counts
- Refugees who arrived through the UK Resettlement Scheme, the Vulnerable Persons and Vulnerable Children Resettlement Schemes or the Mandate Scheme (including community sponsorship) and were first resettled in the council, arrivals from January 2021 to June 2026. Afghan schemes are left out here because the Afghan programme is its own measure
- Period
- January 2021 to June 2026 (arrivals)
- Worked out from
- 0 over 266,241
- Source
- Home Office, Resettlement by local authority detailed datasets, year ending June 2026 (Res_D01 (sheet Data_Res_D01)); Office for National Statistics, Population estimates for the UK, England, Wales, Scotland and Northern Ireland: mid-2025 (MYE2 - Persons (single year of age, local authorities))
- Status
- Accredited official statistics
People in the Afghan Resettlement Programme
per 1,000 residents · 30 June 2026
What this counts
- What it counts
- People on the Afghan Resettlement Programme living in the council on 30 June 2026, in transitional accommodation or settled in council or private rented housing
- Period
- 30 June 2026
- Worked out from
- 44 over 266,241
- Source
- Home Office, Regional and local authority data on immigration groups, year ending June 2026 (Reg_02: Immigration groups, by Local Authority, as at 30 June 2026); Office for National Statistics, Population estimates for the UK, England, Wales, Scotland and Northern Ireland: mid-2025 (MYE2 - Persons (single year of age, local authorities))
- Status
- Statistical data set. The Homes for Ukraine and Afghan programme figures are management information, not quality assured to the level of official statistics (Home Office)
Homes for Ukraine arrivals
per 1,000 residents · March 2022 to 30 June 2026 (cumulative arrivals)
What this counts
- What it counts
- People who arrived in the UK under the Homes for Ukraine scheme with a sponsor in the council, all arrivals since March 2022 (not people living there now). Excludes arrivals with a 'super sponsor' (the Scottish and Welsh governments)
- Period
- March 2022 to 30 June 2026 (cumulative arrivals)
- Worked out from
- 572 over 266,241
- Source
- Home Office, Regional and local authority data on immigration groups, year ending June 2026 (Reg_02: Immigration groups, by Local Authority, as at 30 June 2026); Office for National Statistics, Population estimates for the UK, England, Wales, Scotland and Northern Ireland: mid-2025 (MYE2 - Persons (single year of age, local authorities))
- Status
- Statistical data set. The Homes for Ukraine and Afghan programme figures are management information, not quality assured to the level of official statistics (Home Office)
Work and pay
New National Insurance numbers for adults from overseas
per 1,000 residents aged 16 and over · April 2025 to March 2026
What this counts
- What it counts
- Adults with a non-UK nationality newly registered for a National Insurance number, by the address given at registration, in the year April 2025 to March 2026. A registration is not a resident: people can register and later leave
- Period
- April 2025 to March 2026
- Worked out from
- 4,415 over 220,037
- Source
- Department for Work and Pensions, Stat-Xplore: NINo Registrations To Adult Overseas Nationals Entering The UK (Ready-made tables 'NINO 3 - Local Authority by Latest Rolling Years' (Great Britain) and 'NINO 4 - Northern Ireland District by Latest Rolling Years', with the field 'Rolling year end March' set to 2016/17 to 2025/26); Office for National Statistics, Population estimates for the UK, England, Wales, Scotland and Northern Ireland: mid-2025 (MYE2 - Persons (single year of age, local authorities))
- Status
- Accredited official statistics. Stat-Xplore applies statistical disclosure control, so totals may not sum exactly
Change in new National Insurance numbers for adults from overseas over five years
% change in the count · 2020/21 to 2025/26
What this counts
- What it counts
- Registrations in April 2025 to March 2026 compared with April 2020 to March 2021 (counts, not rates). The 2020/21 year was during the pandemic
- Period
- 2020/21 to 2025/26
- Worked out from
- 2,598 over 1,817
- Source
- Department for Work and Pensions, Stat-Xplore: NINo Registrations To Adult Overseas Nationals Entering The UK (Ready-made tables 'NINO 3 - Local Authority by Latest Rolling Years' (Great Britain) and 'NINO 4 - Northern Ireland District by Latest Rolling Years', with the field 'Rolling year end March' set to 2016/17 to 2025/26)
- Status
- Accredited official statistics. Stat-Xplore applies statistical disclosure control, so totals may not sum exactly
Median weekly pay of full-time employees living in the council
£ per week, before tax · April 2025 (provisional)
What this counts
- What it counts
- Median gross weekly pay of full-time employee jobs held by people who live in the council, April 2025. Survey estimate
- Period
- April 2025 (provisional)
- Survey precision
- Coefficient of variation 5.4%. The ONS treats under 5% as precise, 5% to 10% as reasonably precise and 10% to 20% as acceptable.
- Source
- Office for National Statistics, Earnings and hours worked, place of residence by local authority: ASHE Table 8, 2025 provisional (Table 8.1a Weekly pay - Gross 2025, sheet Full-Time, column Median; Table 8.1b (CV) for its coefficient of variation)
- Status
- Official statistics, provisional (ONS revises each year's figures a year later)
DWP benefit spending
DWP benefit spending per resident
£ per resident, cash (nominal) terms · April 2024 to March 2025
What this counts
- What it counts
- Estimated DWP spending in 2024/25 on all DWP benefits DWP attributes to the council, paid to residents of the council of any nationality, divided by the council's population. Modelled by DWP from caseloads and average awards
- Period
- April 2024 to March 2025
- Worked out from
- £1,263.7 million over 266,241
- Source
- Department for Work and Pensions, Benefit expenditure by local authority, 2002/03 to 2024/25 (Benefit expenditure and caseload tables 2025) (One sheet per financial year (2002-03 to 2024-25), £ million, nominal terms); Office for National Statistics, Population estimates for the UK, England, Wales, Scotland and Northern Ireland: mid-2025 (MYE2 - Persons (single year of age, local authorities))
- Status
- DWP statistical tables (GOV.UK type 'research'), not badged as official statistics. Modelled: caseload times average award, scaled to outturn
DWP spending on pensioner benefits per resident
£ per resident, cash (nominal) terms · April 2024 to March 2025
What this counts
- What it counts
- Estimated DWP spending in 2024/25 on State Pension, Pension Credit, Attendance Allowance, Winter Fuel Payments and the pensioner parts of Disability Living Allowance and Severe Disablement Allowance, paid to residents of the council of any nationality, divided by the council's population. Modelled by DWP from caseloads and average awards
- Period
- April 2024 to March 2025
- Worked out from
- £280.4 million over 266,241
- Source
- Department for Work and Pensions, Benefit expenditure by local authority, 2002/03 to 2024/25 (Benefit expenditure and caseload tables 2025) (One sheet per financial year (2002-03 to 2024-25), £ million, nominal terms); Office for National Statistics, Population estimates for the UK, England, Wales, Scotland and Northern Ireland: mid-2025 (MYE2 - Persons (single year of age, local authorities))
- Status
- DWP statistical tables (GOV.UK type 'research'), not badged as official statistics. Modelled: caseload times average award, scaled to outturn
DWP spending on working-age and children's benefits per resident
£ per resident, cash (nominal) terms · April 2024 to March 2025
What this counts
- What it counts
- Estimated DWP spending in 2024/25 on Universal Credit, Employment and Support Allowance, Jobseeker's Allowance, Income Support, Carer's Allowance, bereavement benefits, Discretionary Housing Payments and the child and working-age parts of Disability Living Allowance and Severe Disablement Allowance, paid to residents of the council of any nationality, divided by the council's population. Modelled by DWP from caseloads and average awards
- Period
- April 2024 to March 2025
- Worked out from
- £661.0 million over 266,241
- Source
- Department for Work and Pensions, Benefit expenditure by local authority, 2002/03 to 2024/25 (Benefit expenditure and caseload tables 2025) (One sheet per financial year (2002-03 to 2024-25), £ million, nominal terms); Office for National Statistics, Population estimates for the UK, England, Wales, Scotland and Northern Ireland: mid-2025 (MYE2 - Persons (single year of age, local authorities))
- Status
- DWP statistical tables (GOV.UK type 'research'), not badged as official statistics. Modelled: caseload times average award, scaled to outturn
DWP spending on Housing Benefit and PIP per resident (not split by age)
£ per resident, cash (nominal) terms · April 2024 to March 2025
What this counts
- What it counts
- Estimated DWP spending in 2024/25 on Housing Benefit and Personal Independence Payment, which DWP's local authority table does not split by age, and the small part of Disability Living Allowance and Severe Disablement Allowance it gives no age group, paid to residents of the council of any nationality, divided by the council's population. Modelled by DWP from caseloads and average awards
- Period
- April 2024 to March 2025
- Worked out from
- £322.2 million over 266,241
- Source
- Department for Work and Pensions, Benefit expenditure by local authority, 2002/03 to 2024/25 (Benefit expenditure and caseload tables 2025) (One sheet per financial year (2002-03 to 2024-25), £ million, nominal terms); Office for National Statistics, Population estimates for the UK, England, Wales, Scotland and Northern Ireland: mid-2025 (MYE2 - Persons (single year of age, local authorities))
- Status
- DWP statistical tables (GOV.UK type 'research'), not badged as official statistics. Modelled: caseload times average award, scaled to outturn
Over time
Every published series for this council. Hover or tap a chart to read each date.
People in asylum support
people, at each quarter end · Mar 2014 to Jun 2026
The hatched quarters have no subsistence-only figures by council, so the count is lower there.
People in Home Office asylum support at each quarter end. Section 4 support is counted by council only from 2018, and section 98 from December 2022, so earlier counts leave those out. Home Office, Asy_D11.
People in asylum hotels
people, at each quarter end · Dec 2022 to Jun 2026
People in asylum support housed in contingency hotels at each quarter end, from December 2022, the first quarter the table counts them. Home Office, Asy_D11.
Afghan Resettlement Programme
people, at each quarter end · Mar 2023 to Jun 2026
People on the programme living in the council at each quarter end. Home Office management information. Home Office, Reg_02, each quarterly edition.
Homes for Ukraine arrivals
people, added up since March 2022 · Mar 2023 to Jun 2026
Arrivals with a sponsor in the council, added up since the scheme began in March 2022. Not people living there now. Home Office management information. Home Office, Reg_02, each quarterly edition.
Resettled through UK schemes
people arriving each year (2026 is January to June) · 2014 to 2026
Refugees arriving through the UK Resettlement Scheme, the Vulnerable Persons and Vulnerable Children schemes and the Mandate Scheme, by calendar year. 2026 is January to June. Home Office, Res_D01.
New NI numbers, adults from overseas
registrations each year, April to March · 2016/17 to 2025/26
New National Insurance numbers for adults from overseas, by the address given at registration. 2020/21 was during the pandemic. A registration is not a resident. DWP Stat-Xplore.
DWP benefit spending
£ million each year, cash terms · 2002/03 to 2024/25
The ringed point, 2018/19, is flagged. DWP's 2018/19 total is £38.81m more than its benefit lines add up to here, the same as its Personal Independence Payment for under-65s, which looks counted twice. The total is shown as published. No rank or Biggest changes window uses 2018/19.
The ringed point, 2020/21, is flagged. DWP's 2020/21 total leaves out Universal Credit (£259.34m here), which its table shows separately. The total is shown as published. No rank or Biggest changes window uses 2020/21.
Cash terms, not adjusted for inflation. Modelled by DWP from caseloads and average awards. Universal Credit is in DWP's council figures only from 2019/20. DWP, benefit expenditure by local authority.
Councils like this
The five councils closest to it on population, share aged 65 and over, median pay, rural-urban class and region. A comparison, not a control.
- SouthwarkLondon · 312,366 people, 9.6% aged 65+, £939.90 a week
- LambethLondon · 314,298 people, 10.0% aged 65+, £946.60 a week
- IslingtonLondon · 224,551 people, 10.0% aged 65+, £1,005.00 a week
- Waltham ForestLondon · 283,713 people, 11.0% aged 65+, £900.80 a week
- Tower HamletsLondon · 334,240 people, 6.1% aged 65+, £996.60 a week
Sources and method
- Office for National StatisticsPopulation estimates for the UK, England, Wales, Scotland and Northern Ireland: mid-2025 · Source
MYE2 - Persons (single year of age, local authorities) · published 2026-10-01 · Official statistics - Office for National StatisticsCensus 2021: Country of birth (TS004), lower tier local authorities, England and Wales · Source
census2021-ts004-llta.csv: 'Country of birth: Total' and 'Country of birth: Europe: United Kingdom' (2021 council codes; the 2023 Cumbria, North Yorkshire and Somerset councils are the sum of the districts they replaced) · published 2022-11-02 · Accredited official statistics - ONS, NRS and NISRACountry of birth at Scotland's Census 2022 (NRS UV204b, added up from data zones) and international migration in the year to mid-2025, as used on this site's population map
- Home OfficeAsylum seekers in receipt of support by local authority detailed datasets, year ending June 2026 · Source
Asy_D11 (sheet Data_Asy_D11) · published 2026-08-27 · Accredited official statistics (support data from 2018 marked provisional by the Home Office) - Home OfficeResettlement by local authority detailed datasets, year ending June 2026 · Source
Res_D01 (sheet Data_Res_D01) · published 2026-08-27 · Accredited official statistics - Home OfficeRegional and local authority data on immigration groups, year ending June 2026 · Source
Reg_02: Immigration groups, by Local Authority, as at 30 June 2026 · published 2026-08-27 · Statistical data set. The Homes for Ukraine and Afghan programme figures are management information, not quality assured to the level of official statistics (Home Office) - Department for Work and PensionsStat-Xplore: NINo Registrations To Adult Overseas Nationals Entering The UK · Source
Ready-made tables 'NINO 3 - Local Authority by Latest Rolling Years' (Great Britain) and 'NINO 4 - Northern Ireland District by Latest Rolling Years', with the field 'Rolling year end March' set to 2016/17 to 2025/26 · published 2026-05-21 · Accredited official statistics. Stat-Xplore applies statistical disclosure control, so totals may not sum exactly - Office for National StatisticsEarnings and hours worked, place of residence by local authority: ASHE Table 8, 2025 provisional · Source
Table 8.1a Weekly pay - Gross 2025, sheet Full-Time, column Median; Table 8.1b (CV) for its coefficient of variation · published 2025-10-23 · Official statistics, provisional (ONS revises each year's figures a year later) - Department for Work and PensionsBenefit expenditure by local authority, 2002/03 to 2024/25 (Benefit expenditure and caseload tables 2025) · Source
One sheet per financial year (2002-03 to 2024-25), £ million, nominal terms · published 2025-12-18 · DWP statistical tables (GOV.UK type 'research'), not badged as official statistics. Modelled: caseload times average award, scaled to outturn - Home OfficeRegional and local authority data on immigration groups, every quarterly edition from year ending March 2023 · Source
Reg_02 in each edition - Local Government Association (LG Inform)LG Inform: council seats held by party (metrics 3380 total, 3381 Conservative, 3382 Labour, 3383 Liberal Democrat, 25972 Reform UK, 28307 Green, 19661 Independent candidates and Other parties) · Source
LGA standard report, table of all English (or Welsh) authorities for the latest election period · LG Inform metric. LG Inform's note: a snapshot immediately after the main round of local elections, not updated for by-elections or councillors changing party. Source named on LG Inform: The Elections Centre, Local Elections Handbook (Nuffield Politics Research Centre and House of Commons Library results) - House of Commons LibraryElection results: 2024 general election, candidacies · Source
candidacies.csv (one row per candidate; Candidate result position 1 = winner) · published 2024-07-05 · House of Commons Library election results data - Office for National StatisticsRural Urban Classification (2021) of Local Authority Districts (2024) in EW · Source
LAD24CD, RUC21CD, RUC21NM · Official classification (England and Wales only)
Ranks. 1 is the highest value. Ranks are worked out on the figures as stored (two more decimal places than shown), and councils with the same stored figure share the better rank. Each rank is out of the councils that have a figure on that measure, so the number ranked can be under 361.
One base for every rate. Every rate divides by the council's mid-2025 population (ONS), including DWP spending for 2024/25, so all councils share one base.
Councils like this. The five councils nearest on population (on a log scale), share aged 65 and over, median full-time pay, the ONS 2021 rural-urban class (England and Wales only) and region. Each measure is put on the same scale across all councils before the distances are added. A comparison, not a control: other measures would pick other councils.
Council seats. Seats by party from LG Inform (Local Government Association), as held there in 2026, a snapshot straight after the main round of local elections, not updated for by-elections or councillors changing party. Which party holds more than half is worked out from those seats. It is not a record of who runs the council, which can differ through coalitions, minority administrations and later changes. LG Inform counts Plaid Cymru, local parties and independents together, as independents and other parties, so where that group holds more than half the seats, whether one party holds more than half is not known from this source, and that group is never named as a council's largest party. Districts in two-tier areas also show their county council. Scotland and Northern Ireland are not covered.
MPs. The winner in each 2024 general election constituency that overlaps the council (House of Commons Library results), with the share of the council's residents living in it: Census 2021 output areas in England and Wales (ONS best-fit lookup), NRS mid-2024 data zones in Scotland, and Census 2021 data zones placed by their population centre in Northern Ireland.
The UK figures. The UK bar is the councils' numerators added up over their denominators added up, so it is the UK rate, not an average of councils. Population compares with the median council. DWP spending compares with England and Wales, the councils DWP's figures rank. Median pay is the ONS's own UK median from the same table.
DWP totals in 2018/19 and 2020/21. DWP's 2018/19 total for each council is more than its benefit lines add up to, by the same amount as its Personal Independence Payment for under-65s, which looks counted twice (£9.1 billion across 350 councils). DWP's 2020/21 total for each council leaves out Universal Credit, which its table shows separately (£38.2 billion across 350 councils). The totals are shown as published and the points are ringed on each council's chart. No rank, per-resident figure or Biggest changes period uses either year.
Find your council. A postcode is matched to its council in your browser, from the ONS National Statistics Postcode Lookup (August 2026): the ONS best fit from 2021 Census areas, live postcodes only. Your full postcode stays on this device: your browser fetches only the small file for its first half (SW1A for SW1A 1AA) from this site, and works out the council itself. Northern Ireland postcodes are not included, because their licence does not allow publishing them on a free public site. Source: Office for National Statistics licensed under the Open Government Licence v.3.0. Contains OS data © Crown copyright and database right 2026. Contains Royal Mail data © Royal Mail copyright and database right 2026.
Checked. Every figure here passed the site's independent check against its primary source.
Share Hackney
The link opens this page, with a card of the measures where it stands out.
Questions people ask
How many asylum seekers are in Hackney?
On 30 June 2026, 373 asylum seekers with an address in Hackney were in Home Office support, 1.4 per 1,000 residents, the 115th highest of 361 councils, according to the Home Office (table Asy_D11), which marks it provisional.
How many people in Hackney were born outside the UK?
At the 2021 census (21 March 2021), 39.7% of Hackney's residents (102,927 people) were born outside the UK, the 22nd highest of 361 councils, according to the ONS (Census 2021, table TS004).
What is the population of Hackney?
Hackney had 266,241 residents in mid-2025 (30 June 2025), the 78th highest of 361 councils, according to the ONS (mid-2025 population estimates).
How much does DWP spend on benefits in Hackney?
DWP spent £4,746 per resident on benefits in Hackney in 2024/25 (April 2024 to March 2025), the 59th highest of 318 councils, and £1,263.7 million in total, according to DWP (benefit expenditure by local authority).